Foreword: George P. Shultz, Paul Volcker, Michael Bloomberg, Richard Ravitch and John Doerr
About USA Inc. This report looks at the federal government as if it were a business, with the goal of informing the debate about our nation’s financial situation and outlook. In it, we examine USA Inc.’s income statement and balance sheet. We aim to interpret the underlying data and facts and illustrate patterns and trends in easy-to-understand ways. We analyze the drivers of federal revenue and the history of expense growth, and we examine basic scenarios for how America might move toward positive cash flow.
Summary: By the standards of any public corporation, USA Inc.’s financials are discouraging.
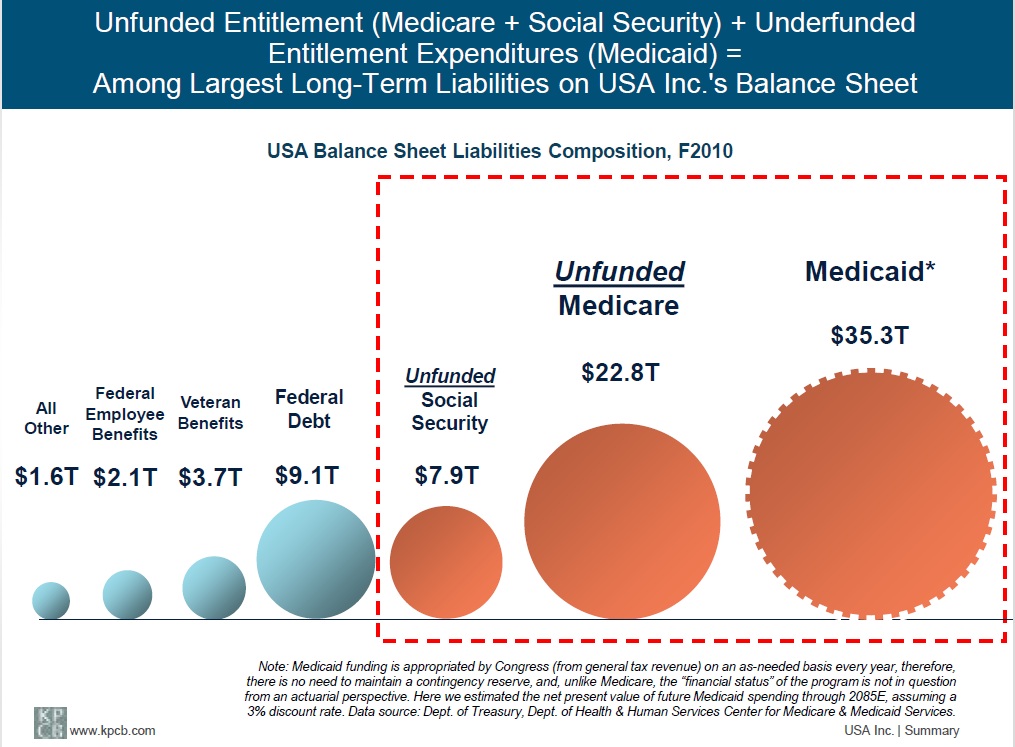
Underfunded entitlements are among the most severe financial burdens USA Inc. faces. And because some of the most underfunded programs are intended to help the nation’s poorest, the electorate must understand the full dimensions of the challenges.
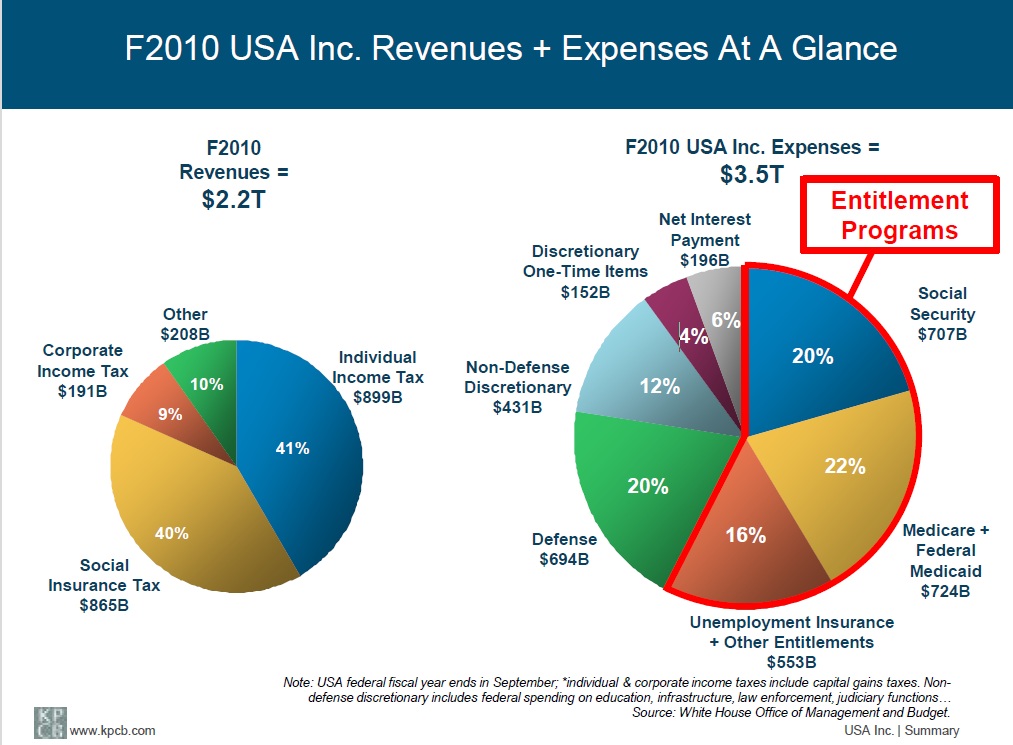
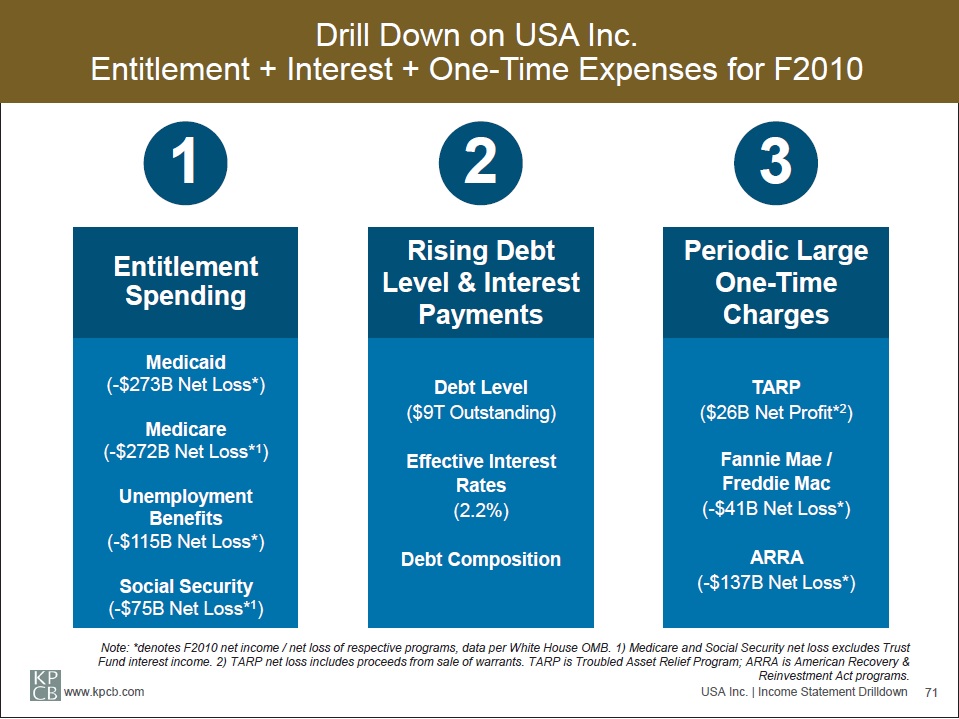
Millions of Americans have come to rely on Medicare and Medicaid and spending has skyrocketed, to 21% of USA Inc.’s total expenses (or $724B) in F2010, up from 5% forty years ago.
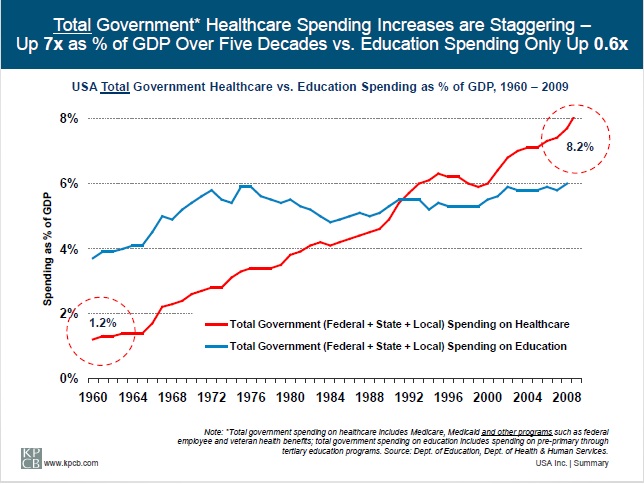
Amid the rancor about government’s role in healthcare spending, one fact is undeniable: government spending on healthcare now consumes 8.2% of GDP, compared with just 1.3% fifty years ago.
Unemployment Insurance and Social Security are adequately funded...for now.
Their future, unfortunately, isn’t so clear.
Regardless of the emotional debate about entitlements, fiscal reality can’t be ignored – if these programs aren’t reformed, one way or another, USA Inc.’s balance sheet will go from bad to worse.
Federal Government Spending Had Risen to 24% of GDP in 2010, Up From an Average of 3% From 1790 to 1930
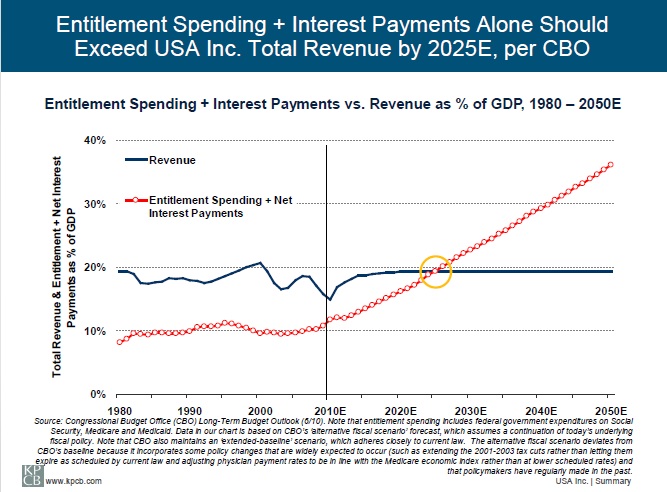
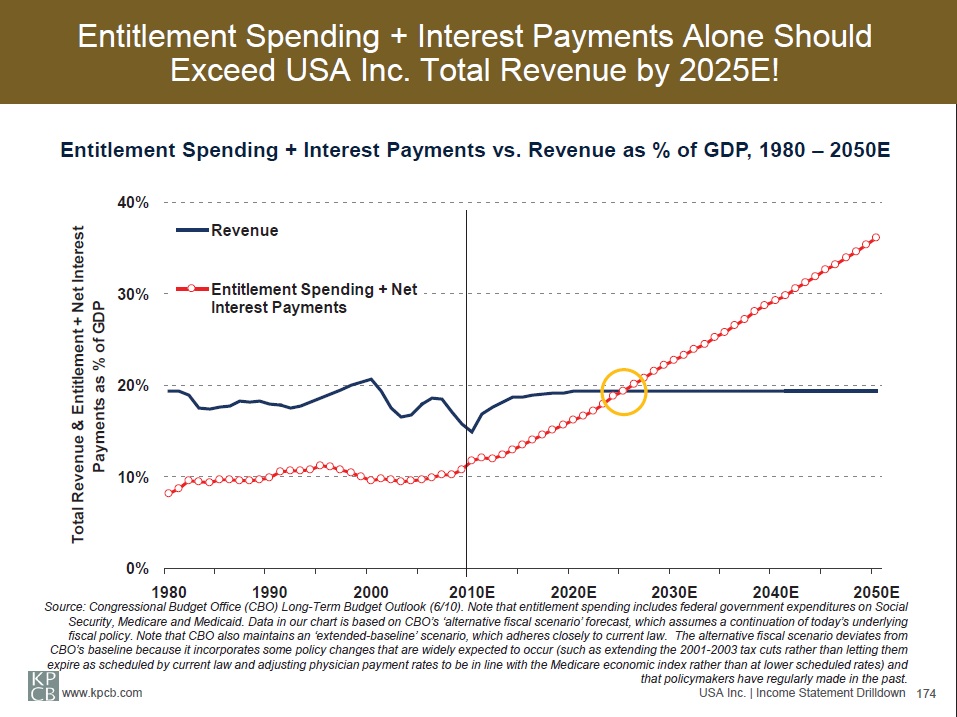
Entitlement Spending Increased 11x While Real GDP Grew 3x Over Past 45 Years The problem gets worse. Even as USA Inc.’s debt has been rising for decades, plunging interest rates have kept the cost of supporting it relatively steady. Last year’s interest bill would have been 155% (or $290 billion) higher if rates had been at their 30-year average of 6% (vs. 2% in 2010). As debt levels rise and interest rates normalize, net interest payments could grow 20% or more annually. Below-average debt maturities in recent years have also kept the Treasury’s borrowing costs down, but this trend, too, will drive up interest payments once interest rates rise.
Can we afford to wait until the turning point comes? By 2025, entitlements plus net interest payments will absorb all – yes, all – of USA Inc.'s revenue, per CBO.
At the same time, however, these numbers don’t lie. With our demographics and our debts, we’re on a collision course with the future. The good news: Although time is growing short, we still have the capacity to create positive outcomes.
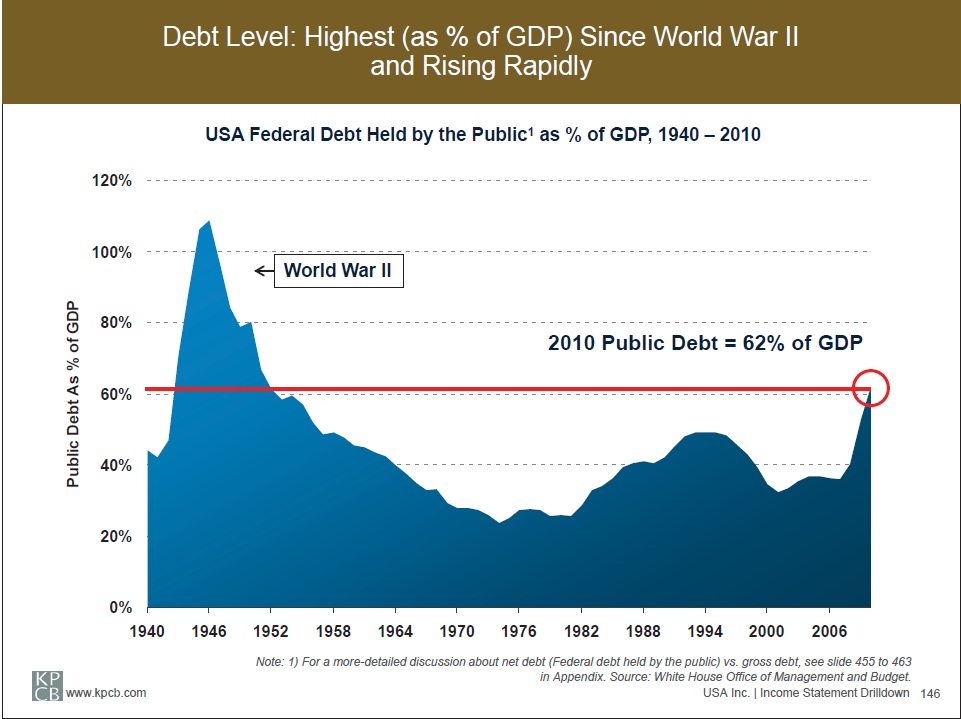
Even though USA Inc. can print money and raise taxes, USA Inc. cannot sustain its financial imbalance indefinitely – especially as the Baby Boomer generation nears retirement age. Net debt levels are approaching warning levels, and some polls suggest that Americans consider reducing debt a national priority. Change is legally possible. Unlike underfunded pension liabilities that can
bankrupt companies, USA Inc.’s underfunded liabilities are not legal contracts.
Congress has the authority to change the level and conditions for Social Security and Medicare benefits; the federal government, together with the states, can also alter eligibility and benefit levels for Medicaid.
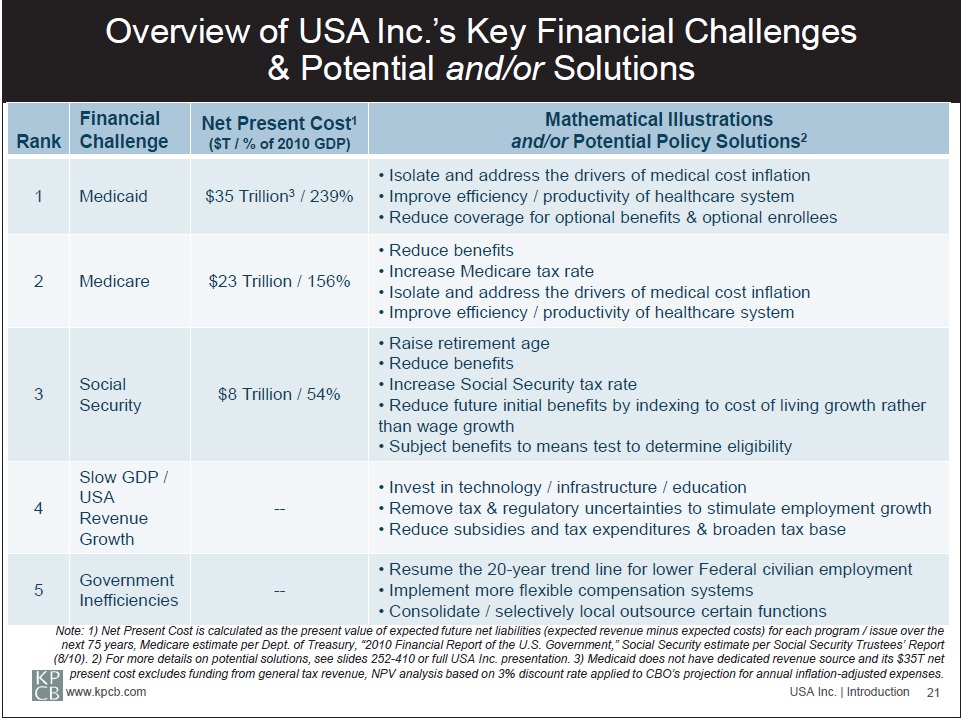
Options for entitlement reform, operating efficiency, and stronger long-term GDP growth.
As analysts, not public policy experts, we can offer mathematical illustrations as a framework for discussion (not necessarily as actual solutions).
We also present policy options from third-party organizations such as the CBO.
Reforming entitlement programs – Social Security.
Reforming entitlement programs – Medicare and Medicaid.
Improving operating efficiency.
Improving long-term GDP growth – productivity and employment.
How Much Would Real GDP Need to Grow to Drive USA Inc. to Break-Even Without Policy changes? 6-7% in F2012E-F2014E &4-5% in F2015- F2020EWell Above 40-Year Average of 3%
Since the 1960s, as more resources have gone to entitlements and interest payments, USA Inc. has scaled back its investment in technology R&D and infrastructure as percentages of GDP. Competitors are making these investments.
India plans to double infrastructure spending as a percent of GDP by 2013, and its tertiary (college) educated population will double over the next ten years, according to Morgan Stanley analysts, enabling its GDP growth to accelerate to 9-10% annually by 2015 (China’s annual GDP growth is forecast to remain near 8% by 2015). USA Inc. can’t match India’s demographic advantage, but technology can help.
For employment gains, USA Inc. should minimize tax and regulatory uncertainties and encourage businesses to add workers. While hiring and R&D-related tax credits may add to near-term deficits, over time, they should drive job and GDP growth. Immigration reform could also help: A Federal Reserve study in 2010 shows that immigration does not take jobs from U.S.-born workers but boosts productivity and income per worker.
Changing tax policies.
These issues are undoubtedly complex, and difficult decisions must be made. But inaction may be the greatest risk of all. The time to act is now, and our first responsibility as investors in USA Inc. is to understand the task at hand.
America’s Resources Allocated to Housing + Healthcare Nearly Doubled as a Percent of GDP Since 1965, While Household and Government Savings Fell Dramatically
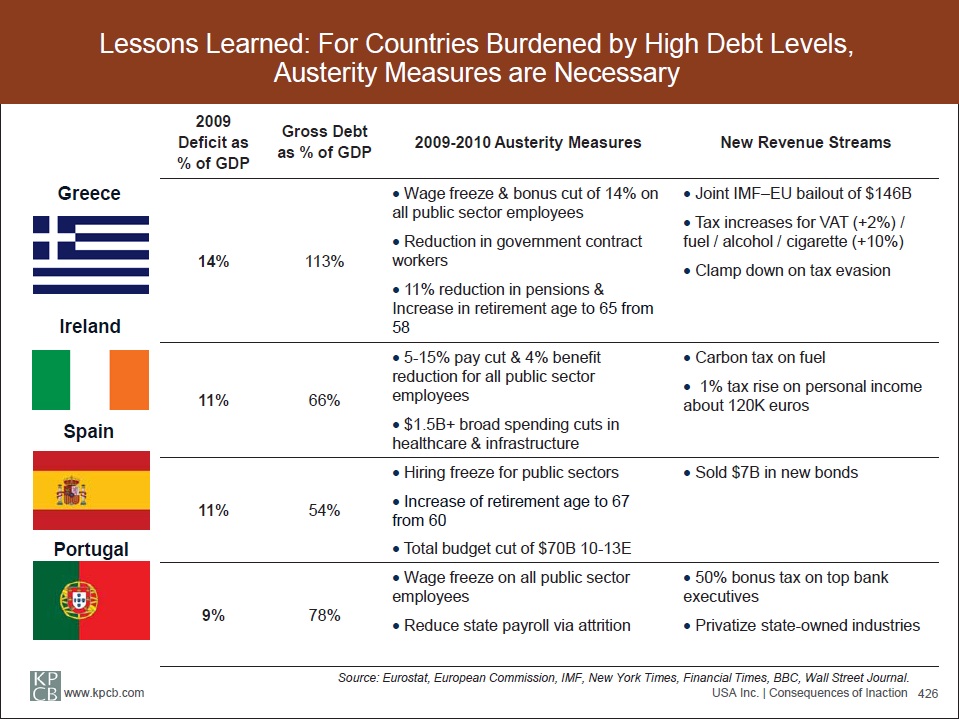
Common principles for overcoming this kind of burden include the following:
1) Acknowledge the problem – some 80% of Americans believe ‘dealing with our growing budget deficit and national debt’ is a national priority, according to a Peter G. Peterson Foundation survey in 11/09;
2) Examine past errors – People need clear descriptions and analysis to understand how the US arrived at its current financial condition – a ‘turnaround CEO’ would certainly initiate a ‘no holds barred’ analysis of the purpose, success and operating efficiency of all of USA Inc.’s spending;
3) Make amends for past errors – Most Americans today at least acknowledge the problems at personal levels and say they rarely or never spend more than what they can afford (63% according to a 2007 Pew Research study). The average American knows the importance of managing a budget. Perhaps more would be willing to sacrifice for the greater good with an understandable plan to serve the country’s long-term best interests;
4) Develop a new code of behavior – Policymakers, businesses (including investment firms), and citizens need to share responsibility for past failures and develop a plan for future successes.
Past generations of Americans have responded to major challenges with collective sacrifice and hard work. Will ours also rise to the occasion?
USA Inc. Concept
Healthy financials and compelling growth prospects are key to success for businesses (and countries). So if the US federal government – which we call USA Inc. – were a business, how would public shareholders view it?
How would long-term investors evaluate the federal government’s business model, strategic plans, and operating efficiency? How would analysts react to its earnings reports? Although some 45% of American households own shares in publicly traded companies and receive related quarterly financial statements, not many “stakeholders” look closely at Washington’s financials. Nearly two-thirds of all American households2 pay federal income taxes, but very few take the time to dig into the numbers of the entity that, on average, collects 13% of all Americans’ annual gross income (not counting another 15-30% for payroll and various state and local taxes).
We drill down on USA Inc.’s past, present, and (in some cases) future financial dynamics and focus on the country’s income statement and balance sheet and related trends. We isolate and review key expense and revenue drivers. On the expense side, we examine the major entitlement programs (Medicare, Medicaid and Social Security) as well as defense and other major discretionary programs. On the revenue side, we focus on GDP growth (driven by labor productivity and employment in the long run) and tax policies.
We present basic numbers-driven scenarios for addressing USA Inc.'s financial challenges. In addition, we lay out the type of basic checklists that corporate turnaround experts might use as starting points when looking at some of USA Inc.’s business model challenges.

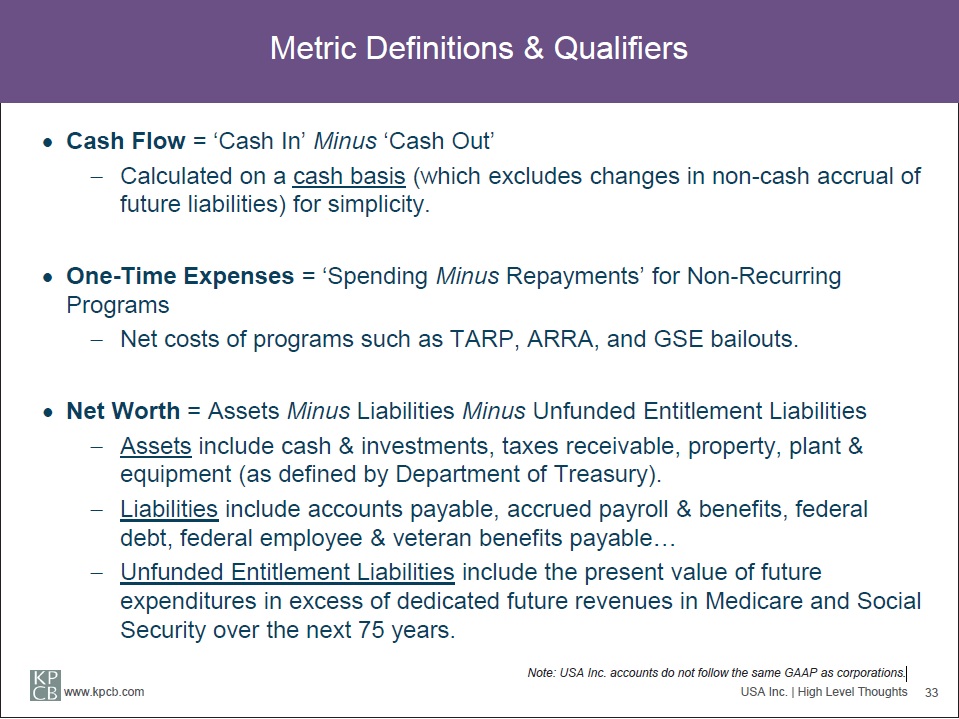
Common Financial Metrics Applied to USA Inc. in F2010
Cash Flow Per Share = -$4,171
USA Inc.’s F2010 cash flow -$1.3 trillion, divided by population of ~310 million (assuming each citizen holds one share of USA Inc.).
Net Debt to EBITDA Ratio = -8x
USA Inc. net debt held by public ($9.1 trillion) divided by USA Inc. F2010 EBITDA (-$1.1 trillion). It’s notable that the ratio compares with S&P500 average of 1.4x in 2010.
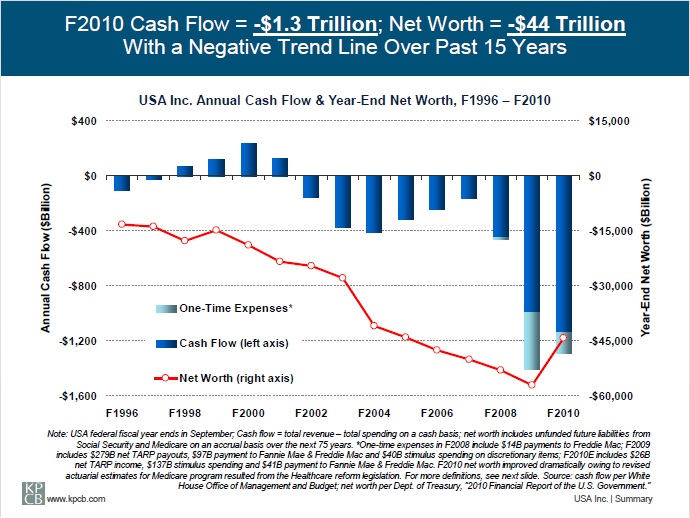
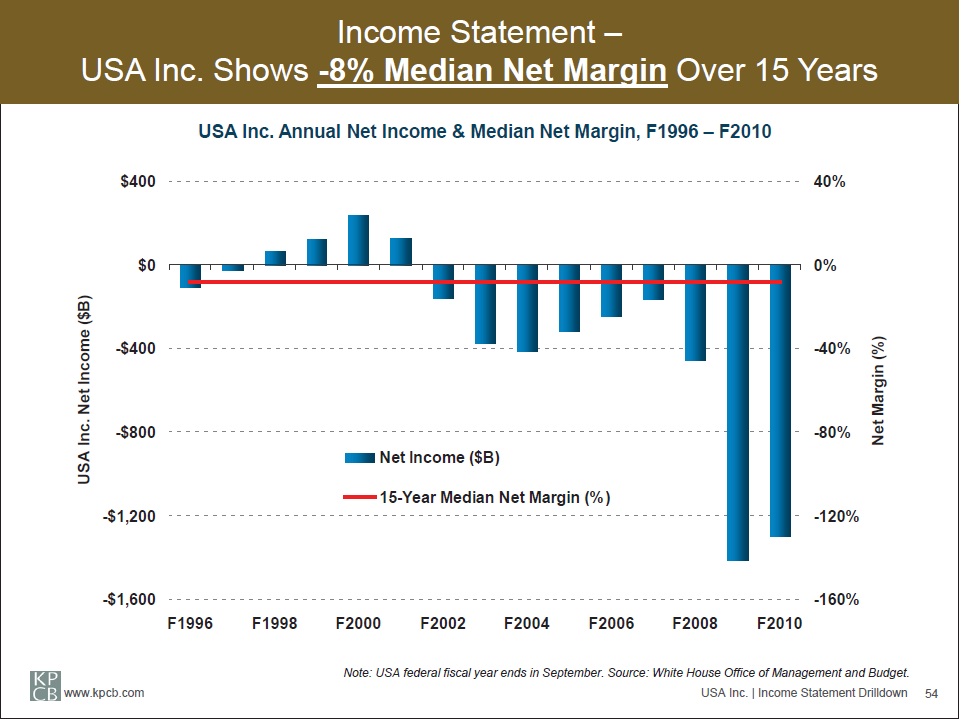
Even Adjusting For Cyclical Impact of Recessions, USA Inc.’s 2010 Structural Operating Loss = -$817 Billion vs. -$78 Billion 15 Years Ago
The Original Estimates of Medicare’s Costs Were Vastly Underestimated
In 1965, the official estimate of Medicare’s costs was $500 million per year, roughly $3 billion in 2005 dollars.*
The actual cost of Medicare has turned out to be 10x that estimate. Medicare’s actual net loss (tax receipts + trust fund interest – expenditures) has exceeded $3 billion (adjusted for inflation) every year since 1976 and was $146 billion in 2008 alone. In other words, had the original estimate been accurate, the cumulative 43-year cost since Medicare was created would have been $129 billion, adjusted for inflation.
In fact, the actual cumulative spending has been $1.4 trillion** (adjusted for inflation)...in effect, 10x over budget.
While calculations have been flawed from the beginning for some of USA Inc.’s entitlement programs, little has been done to correct the problems.
An accurate economic forecast might have sunk Medicare. David Blumenthal and James Morone “The Lessons of Success – Revisiting the Medicare story”, November 2008
Summary: 40-Year USA, Inc. Trends*
America is spending beyond its means, and the problem – with mounting losses & increasing debt – is getting worse, not better
Healthcare spending and obesity are rising dramatically.
Education spending is growing slower than healthcare spending.
Defense spending is declining on relative basis.
More and more Americans are on the government payroll or receive government subsidies for retirement income, medical care, housing, and food.
Inequality of income and wealth is rising, and fewer Americans pay income taxes to support USA Inc.
Government increasingly resorts to borrowing to fund rising spending levels (primarily for entitlement programs)
We begin with the premise that for an enterprise (even a country that can ‘print money’ and tax) to be sustainable, it cannot lose money on an ongoing basis.
Successful businesses (and households) typically base their expenses on their ability to generate present and future revenue – in other words, they don’t spend unless they can pay.
We analyze the data and present scenarios and options for solving the math and financial challenges facing USA Inc.
Conclusions: 100-Year Review of USA Inc. Income Statement
America’s government has grown dramatically - USA Inc.’s revenue as percent of GDP has risen from 2% to 15%. Individual / social insurance (Social Security + Medicare) taxes have risen dramatically while customs / excise / estate taxes have declined in relative importance. In addition, USA Inc.’s spending as percent of GDP has risen to 24% in 2010, up from 3% average between 1790 and 1930.
USA Inc.’s average operating income was at or near breakeven for most of the periods from 1910 to 1970.
In the 1970s, as healthcare expenses (related to Medicare and Medicaid) began to surge, USA Inc. reported more frequent – and bigger – losses. Since 1970, USA Inc. showed a profit just 4 times (F1998-F2001, when economic growth was especially robust and defense spending was relatively low).
General expense trends since 1970: non-defense discretionary spending has been flattish (except in recessions with material one-time charges), healthcare spending (largely Medicare + Medicaid) has risen materially, Social Security spending has been flattish, defense spending has been down to flattish, and interest payments varied with interest rates.

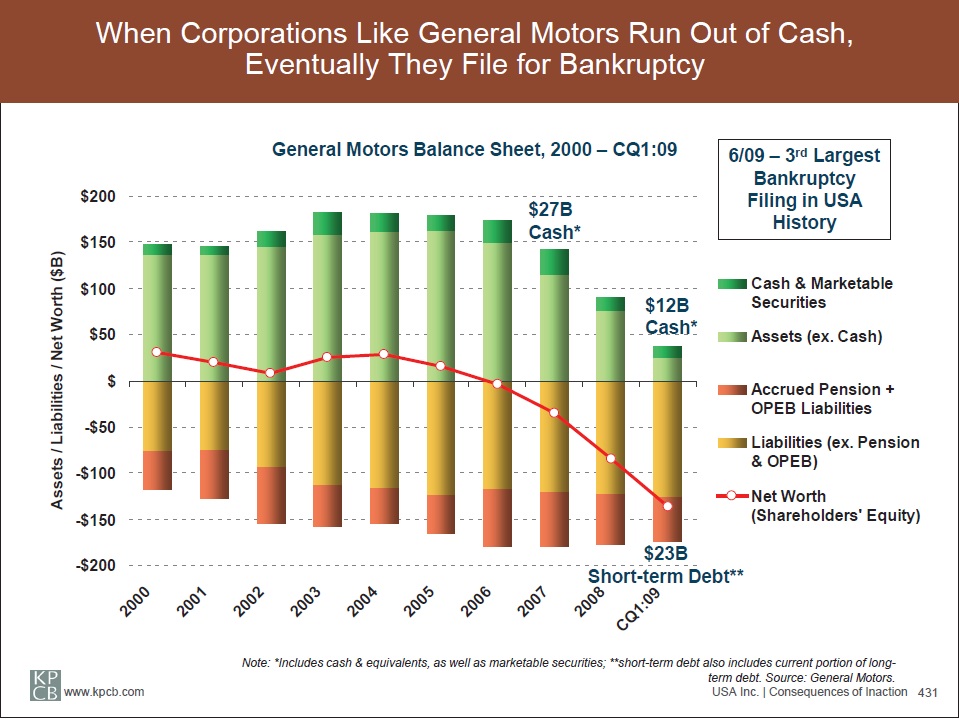
General Motors – Entitlement Spending Became Too Onerous for this Great American Company
1908 – Founded in Flint, Michigan to manufacture automobiles
1954 – Shipped 50 millionth automobile
1988 – Free cash flow peaked at $6.3B
1999 – Reached a peak market capitalization of $61B
2006 – Revenue peaked at $207B
2009 – Filed for bankruptcy
Why did GM file for bankruptcy?
Products became increasingly uncompetitive. In addition, pension plans to support 650,000 retirees and their dependents (compared with 80,000 active employees in N. America as of 2010) rose to 4.8% of GM’s annual expenses and $4,679 in annual pension payments per worker to former workers.
Highlights from F2010 USA Inc. Financials
Summary – USA Inc. has challenges.
Cash Flow – While recession depressed F2008-F2010 results, cash flow has been negative for 9 consecutive years ($4.8 trillion, cumulative), with no end to losses in sight. Negative cash flow implies that USA Inc. can't afford the services it is providing to 'customers,' many of whom are people with few alternatives.
Balance Sheet – Net worth is negative and deteriorating.
Off-Balance Sheet Liabilities – Off-balance sheet liabilities of at least $31 trillion (primarily unfunded Medicare and Social Security obligations) amount to nearly $3 for every $1 of debt on the books. Just as unfunded corporate pensions and other post-employment benefits (OPEB) weigh on public corporations, unfunded entitlements, over time, may increase USA Inc.’s cost of capital. And today’s off-balance sheet liabilities will be tomorrow’s on-balance sheet debt.
Conclusion – Publicly traded companies with similar financial trends would be pressed by shareholders to pursue a turnaround. The good news: USA Inc.’s underlying asset base and entrepreneurial culture are strong. The financial trends can shift toward a positive direction, but both ‘management’ and ‘shareholders’ will need collective focus, willpower, commitment, and sacrifice.
Table of Contents
About USA Inc. ∙ ∙ ∙ ∙ ∙ ∙ ∙ ∙ ∙ ∙ ∙ ∙ ∙ ∙ ∙ ∙ ∙ ∙ ∙ ∙ ∙ ∙ ∙ ∙ ∙ ∙ ∙ ∙ ∙ ∙ ∙ ∙ ∙ ∙ ∙ ∙ ∙ ∙ ∙ ∙ ∙ ∙ ii
Foreword ∙ ∙ ∙ ∙ ∙ ∙ ∙ ∙ ∙ ∙ ∙ ∙ ∙ ∙ ∙ ∙ ∙ ∙ ∙ ∙ ∙ ∙ ∙ ∙ ∙ ∙ ∙ ∙ ∙ ∙ ∙ ∙ ∙ ∙ ∙ ∙ ∙ ∙ ∙ ∙ ∙ ∙ ∙ ∙∙ ∙ iii
Summary ∙ ∙ ∙ ∙ ∙ ∙ ∙ ∙ ∙ ∙ ∙ ∙ ∙ ∙ ∙ ∙ ∙ ∙ ∙ ∙ ∙ ∙ ∙ ∙ ∙ ∙ ∙ ∙ ∙ ∙ ∙ ∙ ∙ ∙ ∙ ∙ ∙ ∙∙ ∙ ∙ ∙ ∙ ∙ ∙ ∙ vii
Introduction ∙ ∙ ∙ ∙ ∙ ∙ ∙ ∙ ∙ ∙ ∙ ∙ ∙ ∙ ∙ ∙ ∙ ∙ ∙ ∙ ∙ ∙ ∙ ∙ ∙ ∙ ∙ ∙ ∙ ∙ ∙ ∙ ∙ ∙ ∙ ∙ ∙ ∙ ∙ ∙ ∙ ∙∙ ∙ ∙ 5
High-Level Thoughts on Income Statement/Balance Sheet ∙ ∙ ∙ ∙ 25
Income Statement Drilldown ∙ ∙ ∙ ∙ ∙ ∙ ∙ ∙ ∙ ∙ ∙ ∙ ∙ ∙ ∙ ∙ ∙ ∙ ∙ ∙ ∙ ∙ ∙ ∙ ∙ ∙ ∙ ∙ ∙ ∙ ∙ ∙ 53
Entitlement Spending ∙ ∙ ∙ ∙ ∙ ∙ ∙ ∙ ∙ ∙ ∙ ∙ ∙ ∙ ∙ ∙ ∙ ∙ ∙ ∙ ∙ ∙ ∙ ∙ ∙ ∙ ∙ ∙ ∙ ∙∙ ∙ ∙∙ ∙ 72
Medicaid ∙ ∙ ∙ ∙ ∙ ∙ ∙ ∙ ∙ ∙ ∙ ∙ ∙ ∙ ∙ ∙ ∙ ∙ ∙ ∙ ∙ ∙ ∙ ∙ ∙ ∙ ∙ ∙ ∙ ∙ ∙ ∙ ∙ ∙ ∙∙ ∙ ∙ 94
Medicare ∙ ∙ ∙ ∙ ∙ ∙ ∙ ∙ ∙ ∙ ∙ ∙ ∙ ∙ ∙ ∙ ∙ ∙ ∙ ∙ ∙ ∙ ∙ ∙ ∙ ∙ ∙ ∙ ∙ ∙ ∙ ∙ ∙ ∙ ∙∙ ∙ 100
Unemployment Benefits ∙ ∙ ∙ ∙ ∙ ∙ ∙ ∙ ∙ ∙ ∙ ∙ ∙ ∙ ∙ ∙ ∙ ∙ ∙ ∙ ∙ ∙∙∙ ∙ ∙ 121
Social Security ∙ ∙ ∙ ∙ ∙ ∙ ∙ ∙ ∙ ∙ ∙ ∙ ∙ ∙ ∙ ∙ ∙ ∙ ∙ ∙ ∙ ∙ ∙ ∙ ∙ ∙ ∙ ∙ ∙ ∙ ∙ ∙ 129
Rising Debt Level and Interest Payments ∙ ∙ ∙ ∙ ∙ ∙ ∙ ∙ ∙ ∙ ∙ ∙ ∙ ∙ ∙ ∙ ∙ ∙ 142
Debt Level ∙ ∙ ∙ ∙ ∙ ∙ ∙ ∙ ∙ ∙ ∙ ∙ ∙ ∙ ∙ ∙ ∙ ∙ ∙ ∙ ∙ ∙ ∙ ∙ ∙ ∙ ∙ ∙ ∙ ∙ ∙∙ ∙ ∙ ∙ ∙ ∙ 145
Effective Interest Rates ∙ ∙ ∙ ∙ ∙ ∙ ∙ ∙ ∙ ∙ ∙ ∙ ∙ ∙ ∙ ∙ ∙ ∙ ∙ ∙ ∙ ∙ ∙ ∙ ∙ ∙ 161
Debt Composition ∙ ∙ ∙ ∙ ∙ ∙ ∙ ∙ ∙ ∙ ∙ ∙ ∙ ∙ ∙ ∙ ∙ ∙ ∙ ∙ ∙ ∙ ∙ ∙ ∙ ∙ ∙ ∙∙ ∙ ∙ 168
Periodic Large One-Time Charges ∙ ∙ ∙ ∙ ∙ ∙ ∙ ∙ ∙ ∙ ∙ ∙ ∙ ∙ ∙ ∙ ∙ ∙ ∙ ∙ ∙ ∙ ∙ ∙177
TARP ∙ ∙ ∙ ∙ ∙ ∙ ∙ ∙ ∙ ∙ ∙ ∙ ∙ ∙ ∙ ∙ ∙ ∙ ∙ ∙ ∙ ∙ ∙ ∙ ∙ ∙ ∙ ∙ ∙ ∙ ∙ ∙ ∙ ∙ ∙ ∙ ∙∙ ∙ ∙ ∙ 188
Fannie Mae / Freddie Mac ∙ ∙ ∙ ∙ ∙ ∙ ∙ ∙ ∙ ∙ ∙ ∙ ∙ ∙ ∙ ∙ ∙ ∙ ∙ ∙ ∙ ∙ ∙ ∙ ∙ 193
ARRA ∙ ∙ ∙ ∙ ∙ ∙ ∙ ∙ ∙ ∙ ∙ ∙ ∙ ∙ ∙ ∙ ∙ ∙ ∙ ∙ ∙ ∙ ∙ ∙ ∙ ∙ ∙ ∙ ∙ ∙ ∙ ∙ ∙ ∙ ∙ ∙ ∙ ∙ ∙ ∙ ∙ 200
Balance Sheet Drilldown ∙ ∙ ∙ ∙ ∙ ∙ ∙ ∙ ∙ ∙ ∙ ∙ ∙ ∙ ∙ ∙ ∙ ∙ ∙ ∙ ∙ ∙ ∙ ∙ ∙ ∙ ∙ ∙ ∙ ∙ ∙ ∙ ∙ ∙ ∙ 209
What Might a Turnaround Expert Consider? ∙ ∙ ∙ ∙ ∙ ∙ ∙ ∙ ∙ ∙ ∙ ∙ ∙ ∙ ∙ ∙ ∙ ∙ ∙ ∙ ∙ ∙ 221
High-Level Thoughts on How to Turn Around USA Inc.’s Financial Outlook ∙ ∙ ∙ ∙ 237
Focus on Expenses ∙ ∙ ∙ ∙ ∙ ∙ ∙ ∙ ∙ ∙ ∙ ∙ ∙ ∙ ∙ ∙ ∙ ∙ ∙ ∙ ∙ ∙ ∙ ∙ ∙ ∙ ∙ ∙ ∙ ∙ ∙ ∙ ∙ ∙ ∙ ∙ ∙ ∙ 253
Reform Entitlement Programs ∙ ∙ ∙ ∙ ∙ ∙ ∙ ∙ ∙ ∙ ∙ ∙ ∙ ∙ ∙ ∙ ∙∙ ∙ ∙ ∙ ∙ ∙ 255
Restructure Social Security ∙ ∙ ∙ ∙ ∙ ∙ ∙ ∙ ∙∙ ∙ ∙ ∙ ∙ ∙ ∙ ∙ ∙ ∙ 256
Restructure Medicare & Medicaid ∙ ∙ ∙ ∙ ∙ ∙ ∙ ∙ ∙ ∙ ∙ ∙ ∙ ∙ 268
Focus on Operating Efficiency ∙ ∙ ∙ ∙ ∙ ∙∙ ∙ ∙ ∙ ∙ ∙ ∙ ∙ ∙ ∙ ∙∙ ∙ ∙ ∙ ∙ ∙ ∙ 329
Review Wages & Benefits ∙ ∙ ∙∙ ∙ ∙ ∙ ∙ ∙ ∙ ∙ ∙ ∙ ∙ ∙ ∙ ∙ ∙ ∙ ∙ 335
Review Government Pension Plans ∙ ∙ ∙ ∙ ∙ ∙ ∙ ∙ ∙ ∙ ∙ ∙ 338
Review Role of Unions ∙ ∙ ∙ ∙ ∙ ∙ ∙ ∙ ∙ ∙ ∙ ∙ ∙ ∙ ∙ ∙ ∙ ∙ ∙ ∙ ∙ ∙ 342
Review Cost Structure & Headcount ∙ ∙ ∙ ∙ ∙ ∙ ∙ ∙ ∙ ∙ ∙ ∙ 345
Review Non-Core 'Business' for Out-Sourcing ∙ ∙ ∙ ∙ 349
Focus on Revenues ∙ ∙ ∙ ∙ ∙ ∙ ∙ ∙ ∙ ∙ ∙ ∙ ∙ ∙ ∙ ∙ ∙ ∙ ∙ ∙ ∙ ∙ ∙ ∙ ∙ ∙ ∙ ∙ ∙ ∙ ∙∙ ∙ ∙∙ ∙ ∙∙ ∙ ∙ 355
Drive Sustainable Economic Growth ∙ ∙ ∙ ∙ ∙ ∙ ∙ ∙ ∙ ∙ ∙ ∙ ∙ ∙ ∙ ∙ ∙ 356
Invest in Technology / Infrastructure / Education ∙ ∙ 366
Increase / Improve Employment ∙ ∙ ∙ ∙ ∙ ∙ ∙ ∙ ∙ ∙ ∙ ∙∙ ∙ ∙ 383
Improve Competitiveness ∙ ∙ ∙ ∙ ∙ ∙ ∙ ∙ ∙ ∙ ∙ ∙ ∙ ∙ ∙ ∙ ∙ ∙ ∙ 389
Consider Changing Tax Policies ∙ ∙ ∙ ∙ ∙ ∙ ∙ ∙ ∙ ∙ ∙ ∙ ∙ ∙ ∙ ∙ ∙ ∙ ∙ ∙ ∙ 395
Review Tax Rates ∙ ∙ ∙ ∙ ∙ ∙ ∙ ∙ ∙ ∙ ∙ ∙ ∙ ∙ ∙ ∙ ∙ ∙ ∙∙ ∙ ∙ ∙ ∙ ∙ ∙ 396
Reduce Subsidies / Tax Expenditures / Broaden Tax Base ∙ ∙ ∙ ∙ ∙ ∙ ∙ 400
Consequences of Inaction ∙ ∙ ∙ ∙ ∙ ∙ ∙ ∙ ∙ ∙ ∙ ∙ ∙ ∙ ∙ ∙ ∙ ∙ ∙ ∙ ∙ ∙ ∙ ∙ ∙ ∙ ∙ ∙ ∙ ∙ ∙ ∙ 413
Summary ∙ ∙ ∙ ∙ ∙ ∙ ∙ ∙ ∙ ∙ ∙ ∙ ∙ ∙ ∙ ∙ ∙ ∙ ∙ ∙ ∙ ∙ ∙ ∙ ∙ ∙ ∙ ∙ ∙ ∙ ∙ ∙ ∙ ∙ ∙ ∙ ∙ ∙ ∙ ∙ ∙ ∙ ∙ ∙ 437
Short-Term, Long-Term ∙ ∙ ∙ ∙ ∙ ∙ ∙ ∙ ∙ ∙ ∙ ∙ ∙ ∙ ∙ ∙ ∙ ∙ ∙ ∙ ∙ ∙ ∙ ∙ ∙ ∙ ∙ ∙ ∙ ∙ ∙ 415
Public Debt, Net Worth vs. Peers ∙ ∙ ∙ ∙ ∙ ∙ ∙ ∙ ∙ ∙ ∙ ∙ ∙ ∙ ∙ ∙ ∙ ∙ ∙ ∙ ∙ ∙ ∙ 416
Lessons Learned From Historical Debt Crisis ∙ ∙ ∙ ∙ ∙ ∙ ∙ ∙ ∙ ∙ ∙ ∙ ∙ 422
General Motors ∙ ∙ ∙ ∙ ∙ ∙ ∙ ∙ ∙ ∙ ∙ ∙ ∙ ∙ ∙ ∙ ∙ ∙ ∙ ∙ ∙ ∙ ∙ ∙ ∙ ∙ ∙ ∙ ∙ ∙ ∙ ∙ ∙ ∙ ∙∙∙ ∙ 431
Summary ∙ ∙ ∙ ∙ ∙ ∙ ∙ ∙ ∙ ∙ ∙ ∙ ∙ ∙ ∙ ∙ ∙ ∙ ∙ ∙ ∙ ∙ ∙ ∙ ∙ ∙ ∙ ∙ ∙ ∙ ∙ ∙ ∙ ∙ ∙ ∙ ∙ ∙ ∙ ∙ ∙ ∙ ∙ ∙ 437
Highlights of USA Inc.
Foreword: George P. Shultz, Paul Volcker, Michael Bloomberg, Richard Ravitch and John Doerr